Bollinger Bands Indicator for Swing Trading: A Practical Guide
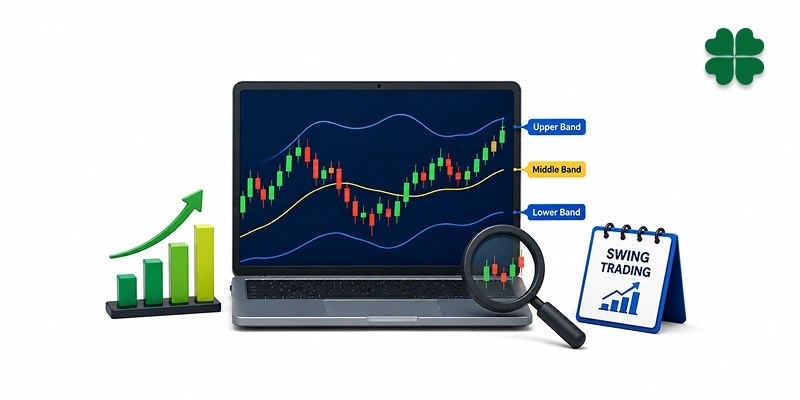
Swing trading capturing price moves that play out over days or weeks has grown increasingly popular among retail investors in India. Traders lean on many tools to time their entries and exits, but few are as widely used as the Bollinger Bands indicator. These Bands help traders track market volatility, spot potential overbought and oversold zones, and read price action against recent trends. This guide breaks down what the indicator is, the math behind it, the most popular strategies built around it, and how it applies to the Indian stock market.
What are Bollinger Bands?
Developed by John Bollinger in the 1980s, Bollinger Bands are a technical analysis tool made up of three lines plotted over a price chart:
- Middle Band
- Upper Band
- Lower Band
The middle band is typically a 20-day simple moving average (SMA) – the average closing price over the last 20 trading sessions. The upper and lower bands sit a fixed number of standard deviations (usually two) above and below that average.
Because the bands are built on standard deviation, they widen when volatility rises and tighten when it falls. This gives traders a quick visual read on how far current prices have strayed from their recent average and how turbulent the market currently is.
| Component | Description |
|---|---|
| Middle Band | 20-period Simple Moving Average (default setting) |
| Upper Band | SMA + (2 × Standard Deviation) |
| Lower Band | SMA − (2 × Standard Deviation) |
The 20-period, 2-standard-deviation setup is the default, but both parameters can be tuned to fit a trader’s style or the security being analyzed.
The Bollinger Bands Formula
Middle Band = 20-period Simple Moving Average (SMA)
Upper Band = SMA + (2 × Standard Deviation)
Lower Band = SMA − (2 × Standard Deviation)
- SMA: the average closing price over a chosen number of sessions.
- Standard Deviation: how far prices swing away from the SMA – a proxy for volatility.
Higher volatility pushes the standard deviation up, so the bands expand. Calmer markets pull the standard deviation down, so the bands contract.
Why Swing Traders use Bollinger Bands?
Since swing traders are working with multi-day to multi-week price swings rather than intraday noise, Bollinger Bands indicator offer several practical advantages:
- Measure market volatility
- Flag potential breakouts
- Highlight overbought and oversold conditions
- Help time entries and exits
- Complement other technical tools rather than compete with them
Demystifying Volatility: Expansion vs. Compression
Band Expansion – During volatile stretches, the bands widen, signaling larger potential price swings. This often coincides with earnings releases, major economic events, or strong trending markets.
Band Compression – In calmer periods, the bands narrow, reflecting a tighter trading range and falling volatility.
Important caveat: Bollinger Bands indicator tell you volatility is changing – they don’t tell you which direction a breakout will take. That call still needs price action and other indicators.
A Real-Life Example
Say an NSE listed stock has spent three weeks range-bound between ₹950 and ₹970, with no clear trend. During this stretch:
- The bands tighten, signaling reduced volatility.
- Price stays confined to a narrow range, with modest daily swings.
- Volume holds steady, without any notable spike.
A strong close above ₹970 or below ₹950 on rising volume could mark the start of a bigger move but the bands alone won’t confirm whether that move sticks. That’s where price action and supporting indicators come in.
Popular Bollinger Bands Strategies
1. The Bollinger Band Squeeze
A “squeeze” happens when the upper and lower bands pull close together, signaling:
- Reduced volatility
- Minimal price variation
- A higher chance of a bigger move ahead
Swing traders watch for squeezes because they often precede significant breakouts. But the squeeze itself is direction-neutral traders typically wait for price action or another indicator to confirm which way the breakout goes.
2. Trend Following with Bollinger Bands
In Bull markets price tends to ride near the upper band during strong uptrends, with the middle band acting as dynamic support.
In Bear markets price tends to hug the lower band during downtrends, with the middle band acting as dynamic resistance.
Experienced traders avoid the trap of assuming “price at the upper band = overbought, sell now.” Context and trend strength matter more than the band touch itself.
Combining Bollinger Bands with other Indicators
Bollinger Bands Indicator + RSI Indicator
The Relative Strength Index Indicator (RSI) measures the speed and size of recent price moves. A common combo:
- Price hits the lower band + RSI drops below 30 → potentially oversold
- Price hits the upper band + RSI rises above 70 → potentially overbought
Caveat: in a strong trend, RSI can stay overbought or oversold for extended periods, so this isn’t an automatic reversal signal.
Bollinger Bands + MACD
MACD indicator helps confirm the direction and momentum of a trend. Swing traders often look for:
- Price bouncing off the lower band, paired with a bullish MACD crossover, as confirmation of building upside momentum.
- Price breaking below the lower band with MACD showing weakening momentum, which traders may read as a sign of further downside or an impending reversal.
Layering multiple indicators like this helps filter out false signals.
Bollinger Bands + Candlestick Patterns
| Bollinger Bands Signal | Candlestick Confirmation |
|---|---|
| Price near lower band | Bullish Engulfing, Hammer |
| Price near upper band | Shooting Star, Bearish Engulfing |
| Breakout from squeeze | Marubozu candle |
Most disciplined traders won’t act purely because price touches a band they wait for a recognizable candlestick pattern to back it up.
Advantages of Bollinger Bands
- Easy to read: price, moving average, and volatility all show up in a single view approachable for beginners, useful for veterans.
- True volatility measure: unlike indicators that only signal direction, Bollinger Bands actively expand and contract with market conditions.
- Works across markets: equities, indices, ETFs, commodities, and currencies and across most timeframes relevant to swing trading.
- Flexible across strategies: trend-following, mean reversion, breakout trading, and volatility-based approaches can all incorporate Bollinger Bands.
Limitations to Keep in Mind
- Not a standalone buy/sell signal. A touch of the upper or lower band isn’t a guaranteed reversal, and false breakouts are common. Price can also ride outside the bands for a while before snapping back.
- Weaker in sideways markets. Breakout signals are less reliable when the market lacks a clear trend, and usually need extra confirmation.
- Parameter selection matters. The 20-period, 2-standard-deviation default won’t suit every security or trading style – it often needs adjusting.
Putting It Together: A Swing Trade Walkthrough
| Market Observation | Interpretation |
|---|---|
| Bands stay tight for several sessions | Low volatility (Bollinger Band squeeze) |
| Close above the upper band on rising volume | Possible bullish breakout |
| RSI crosses above 50 | Building momentum |
| MACD shows a bullish crossover | Additional confirmation of strength |
From there, the trader monitors the follow-through to confirm the trend is holding.
This kind of layered read is where Bollinger Bands earn their keep – as one piece of a broader picture, not a standalone trigger.
Best Practices for Swing Trading in India
- Factor in the broader market trend before entering a position.
- Cross-check signals with RSI, MACD, or candlestick patterns.
- Don’t trade purely because price touched a band.
- Manage risk with proper position sizing and stop-loss orders.
- Review multiple timeframes before committing to a swing trade.
A structured trading plan makes it far easier to apply these indicators consistently, rather than reactively.
Key Takeaways
Bollinger Bands indicator remain one of the most widely used tools for reading price volatility and market behavior. Understanding the formula and what shifting band width actually signals helps traders interpret price movement more clearly.
For Indian swing traders, Bollinger Bands are most useful for spotting volatility expansion or contraction, flagging potential breakout setups, and gauging the broader trend always in combination with other indicators, price action, and sound risk management.
Frequently Asked Questions
What are Bollinger Bands used for?
They’re a technical indicator used to track market volatility, spot potential breakouts, and assess overbought/oversold conditions relative to price action.
What is the formula for Bollinger Bands?
A 20-period SMA forms the middle band, with the upper and lower bands set two standard deviations above and below it.
Are Bollinger Bands good for swing trading?
Yes, many swing traders use them to gauge volatility, trend strength, and potential breakout setups over days or weeks.
What indicators pair best with Bollinger Bands?
RSI, MACD, moving averages, and candlestick patterns are the most common complements for confirming trade signals.
Can Bollinger Bands forecast market direction?
No. They reflect volatility, not direction. They work best alongside price action and other indicators when evaluating trade setups.