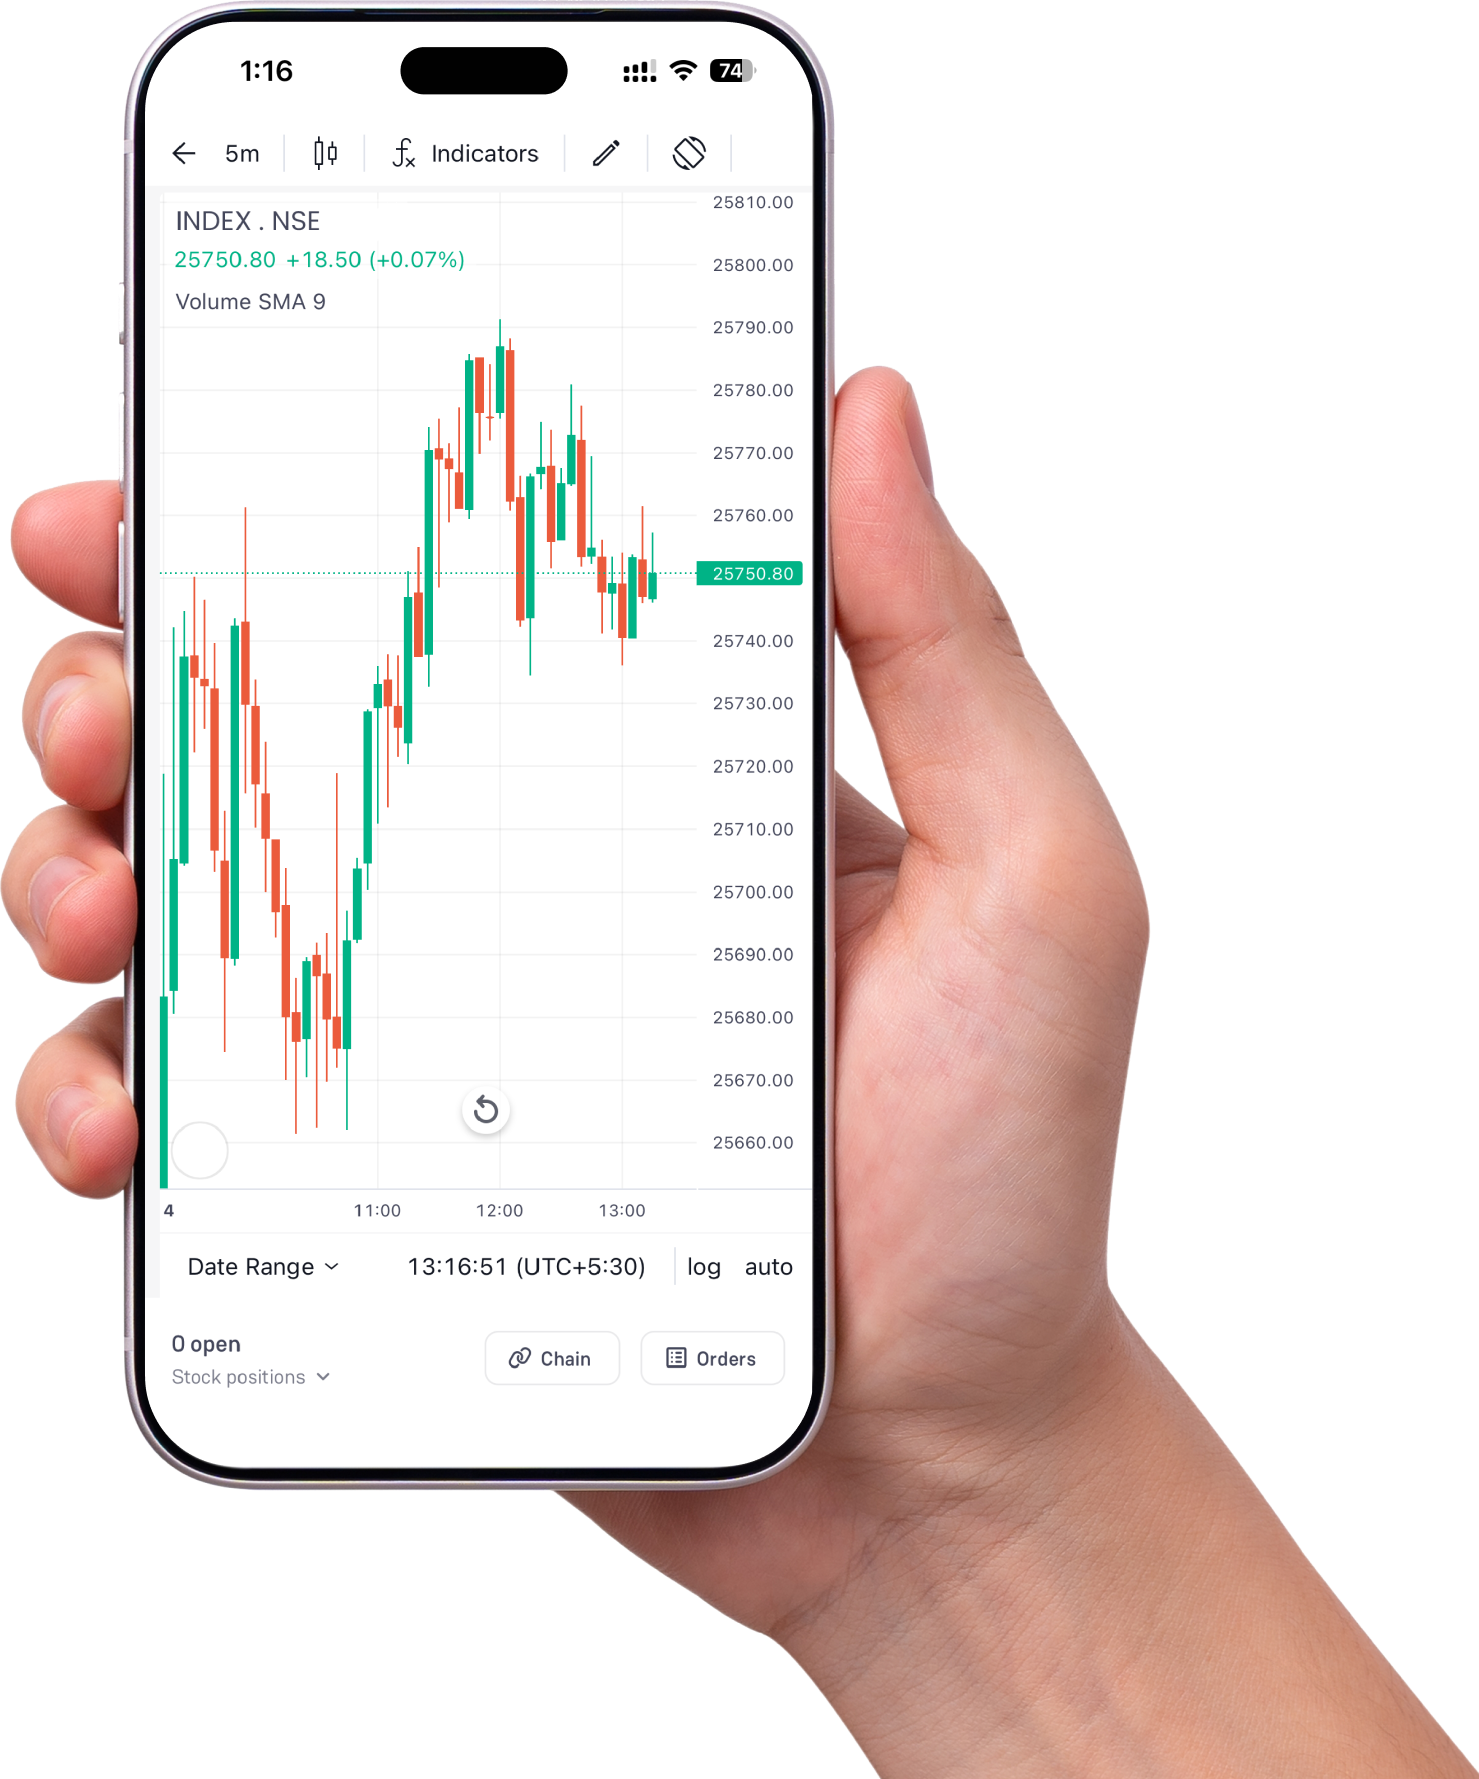
How to use the RSI Indicator Like a Pro?
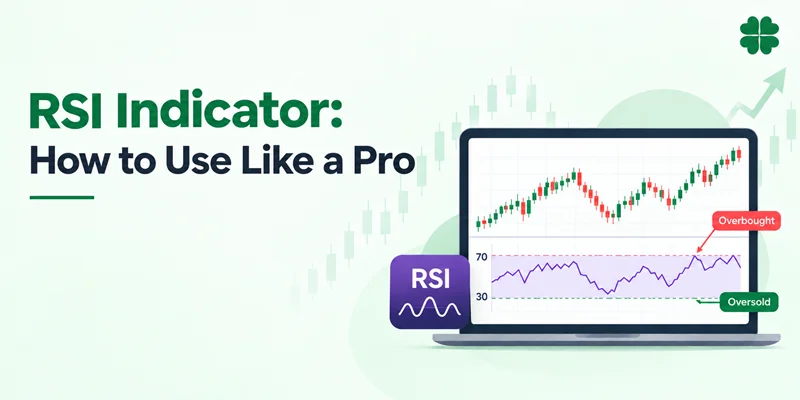
Trading is not possible without proper technical analysis, and technical analysis is not possible without using Technical indicators. As these indicators not only help to identify the trend of the market index or individual stock, but also show the buying and selling point with the potential of upcoming movement. You can find different types of technical indicators integrated into technical analysis or charting software and use them as per your trading strategy. RSI Indicator is one of them, providing very useful insight about the market or individual underlying security.
How RSI Indicator is Calculated?
RSI is usually calculated with a 14-day period, with the range from 0 to 100. It is the average gain divided by the average loss over a chosen look-back period, with the standard of 14 days or trading sessions.
Relative Strength Index formula: RSI = 100-(100/(1+RSI)), in which RS = Average Gain is divided by Average Loss over a set period (usually 14 periods taken).
RSI Indicator Settings: RSI is set at a 14-period lookback with 70/30 (overbought/oversold) levels. However, to get a faster signal, you can also adjust it to 9 or 7 periods with 80/20 levels.
How to Read RSI Indicator?
Relative Strength Index indicator is a momentum oscillator that measures the speed and change of price movements, it is not directly proportional to the price. Reading the RSI is very simple; with certain levels, you need to check where the RSI Indicator is trading and how it is moving.
RSI keeps moving between the 0 and 100 levels. RSI moving above the 70 level indicates the market is trading in the overbought zone, while RSI moving below the 30 level shows the market is trading in the oversold zone. Above and below these RSI levels, there could be a possible trend reversal.
After reaching these levels, the market may reverse or continue in the prevailing trend. Therefore, a few traders use the 20 and 80 levels in RSI to trade with a more conservative strategy. And a value of 50 is considered a neutral trend, or showing a balance between bullish and bearish positions.
How to use RSI Indicator?
Using RSI like a pro will not only enable you to identify the current trend of the market or stock price movement, but also provide a range to enter into long or short positions. Using the RSI signal, you can assess potential entry and exit opportunities alongside other technical indicators and price action. Let’s find out how you can use the RSI indicator in your trading strategy to trade with more informed decisions.
1. Using RSI to Identify the Market or Stock Trend
You can use the RSI to identify the trend of the market or individual stock. RSI moving in the range of 40 and 90 shows an uptrend context, where 40-50 levels act as support levels. On the other hand, RSI moving in the range of 10 to 60 can indicate a downtrend context, with resistance around 50-60 levels. These ranges are guidelines rather than fixed rules.
You can consider 50 as the centreline or crucial point, as when the RSI moves above 50, it generally indicates stronger bullish momentum, and moving below 50 generally indicates stronger bearish momentum.
2. Using RSI to Buy Stocks or enter into a long Trade position
The RSI moves between the range of 0 to 100, but from a trading perspective, the 30 and 70 range is most useful. When the market index or price of an individual stock or an underlying security reaches below the 30 level, as the price is moving in the oversold zone, there is a major possibility of trend reversal.
As shown in the chart above, you can see the RSI of NIFTY 50 trading below 30, bounced back from its bearish trend and entered into a new trading range with positive cues. However, here you need to get confirmation and avoid entering into long trades unless the RSI turns back from its lowest point.
3. Using RSI to Sell the Stock or Exit from Trade Position
Similarly, you can use the RSI for assessing potential selling or exit opportunities. Here you need to check that when RSI moves above the 70 levels, it means now the price is trading in an overbought zone, with the possibility of turning back from a bullish trend.
As depicted in the chart above, you can see that when the RSI of NIFTY 50 breaks its 70 levels, it is the best time to exit from your long trade position or short-sell the stock, with the possibility of a trend reversal. Here, when RSI moves back from 70 levels, a bearish trend starts, giving a selling opportunity for traders.
However, here again you need to be very cautious to get the confirmation with other signals to trade with the right strategy.
Also Read: Best Buy and Sell Indicator TradingView
RSI Indicator Trading Strategy
Merely using the RSI levels would not be enough to make your trades profitable, as sometimes the market turns back or the RSI signal is not strong enough to take the trade decision. Here you need to trade with the right strategy and use the other technical indicators in combination with RSI to validate the trend and find potential buying and selling opportunities in the market.
RSI Crossover Strategy: You can use the RSI for momentum shift in the price by waiting for the RSI line to cross above 30 to buy, or cross below 70 to sell the stock. A crossover above the 50 centre line means a continuing bullish trend, and a cross below 50 gives the signal of a bearish trend.
RSI Convergence Divergence Strategy: RSI convergence happens when price is moving downwards, particularly near the end of the bearish trend, which suggests a potential trend reversal with a bounce back of price. While divergence happens when the RSI does not move in alignment with the price movement.
A positive divergence happens when the RSI moves with higher lows while the price hits lower lows, giving the signal of a potential trend reversal from oversold conditions. A negative divergence occurs when RSI forms lower highs while the price moves with higher highs, giving the signal of potential reversal from overbought conditions.
RSI and MACD Strategy: You can use the RSI with another indicator, moving average convergence divergence (MACD), for a trading strategy. When RSI is entering the oversold zone, at the same time, if MACD is heading towards a bullish crossover, this combination may be interpreted as a potential bullish setup.
On the other hand, when RSI is moving away from the oversold zone, and at the same time the MACD is showing a bearish crossover, it may indicate weakening upward momentum and a potential bearish setup. Apart from this, you can also use the RSI with MACD to know if the price is accelerating or decelerating.
Also Read: RSI and MACD: Powerful Indicators for Stock Traders
RSI and Bollinger Bands Strategy: You can use the RSI in conjunction with Bollinger Bands for trading. A buy signal is visible when RSI falls below 30 and the price drops below the lower Bollinger Band. On the other hand, a sell signal occurs when RSI rises above 70 and the price exceeds the upper Bollinger Band.
RSI Strategy for Intraday Trading: You can also use the RSI for intraday trading, but for that you have to adjust the default parameters (14-day period) to a faster 7-to-9 period setting. Here you need to use the 5-minute or 15-minute charts with more stretched overbought/oversold levels of 80/20 and confirm the trend using other indicators to avoid the false signals given by the RSI.
How to Avoid RSI False Signals?
Relying completely on RSI to take quick trade decisions could be highly risky for anyone. As RSI does not always give the right signal, or sometimes the signals are false or might be reversed as per the changing market conditions. However, you can avoid such false signals if you trade with the following approach.
- Use of Multiple Indicators: One of the best ways to avoid false signals from a technical indicator is to use other indicators in combination with RSI to confirm the same trend or signals.
- Use Multiple Time Frames: Similarly, using RSI with only a specific time frame can give you an incomplete view . Here you need to check the RSI with different time frames like daily, weekly or monthly.
- Trade with Market Trend: Trading against the market trend could be highly risky. Hence, using the RSI to trade as per the market trend comes with more possibility of making your trading strategy successful.
- Confirmation with Volume: Along with RSI movement, also check the trading volume. A bullish or bearish RSI signal supported by strong trading volumes may provide additional confirmation. A weak trading volume means the RSI signal can be false, and you need to avoid trading in such market conditions.
Open your Demat account Today!
Conclusion
RSI can help you to know whether the market is trading in an overbought or oversold zone with potential trade signals to identify buying and selling opportunities in the market. RSI below 30 generally indicates an oversold condition, while RSI above 70 indicates an overbought condition, with a possibility of a trend reversal at these points.
You can use the RSI to identify the market trend or enter into long or short positions with the right strategy. But trusting fully on this indicator alone could be a risky trade decision. Also, use other indicators in conjunction with RSI to confirm the trend and validate your trading strategy to make a more informed decision.
Other Related Links
| Bollinger Bands Indicator | MACD Indicator in stock market |
| Stock Market Indicators Types | Identify Trends With Indicators |
Frequently Asked Questions (FAQs)
How RSI Indicator Works?
RSI works as a momentum oscillator to measure the size and speed of recent price changes in the stock price or market index. It computes average gains and average losses over a 14-day period to show whether the stock is trading into an oversold or overbought zone, with the scale from 0 to 100 levels.
What is period in RSI indicator?
The default set period in RSI is 14 periods, mostly used by traders for most timeframes and trading styles. However, for shorter periods, 7 to 9 periods can be used for a more responsive RSI,, and for long periods, 21 or higher. There is no universally optimal period.
What is the best RSI setting?
The traditional RSI setting is 14 periods with 30 to 70 levels. Depending on the trading strategy and market conditions, traders may use shorter periods or alternative thresholds such as 20 and 80.
What is RSI Trading Strategy?
The RSI trading strategy is that you can consider buying a stock if RSI is below 30 levels or trading into the oversold zone, and you can consider selling the stock when RSI is above 70 levels or trading in the overbought zone. Apart from this, the RSI strategy also includes using the convergence and divergence to identify potential trade opportunities.
What is RSI convergence?
RSI convergence occurs when the price of the RSI and the stock or market index move in the same direction. However, it is not a standalone confirmation of a trend or an indication that a trend reversal cannot occur.
What is divergence in RSI?
RSI divergence happens when the price of the underlying security and RSI move in the opposite direction. It shows the current trend is likely to change with bullish divergence or bearish divergence.
Can I use RSI indicator for Day Trading?
Yes, you can use the RSI for day trading or intraday trading, but you have to adjust the settings for shorter periods with more stretched levels and also use the volume indicators to get more accurate insights.
What is the best RSI setting for Intraday Trading?
The standard RSI settings are 14 periods, but for intraday trading, choosing a shorter period makes the indicator faster and more responsive to rapid price changes on lower timeframes. Hence, for intraday trading, the best RSI settings are recommended to be set at 7 to 9 period length with 80 to 20 levels.
Can RSI be used with other Indicators?
Yes, you can use the RSI Indicator with other technical indicators like Volume Indicators, Bollinger Bands, Moving Averages and Support/Resistance levels as per your trading strategies.
Can I use MACD and RSI together?
Yes, you can use the RSI and MACD in stock market together, as RSI measures the speed and trading zone (overbought or oversold), while MACD Indicator tracks the strength and trend direction of the stock price.
Is higher or lower RSI better?
Higher RSI means, if it is moving above 70, it indicates the market is trading in the overbought zone with upward momentum. While a lower RSI, or below 30, means the market is trading in an oversold trading zone.