Mastering TradingView: Your Complete Guide to Trading and Analysis
TradingView is a widely used platform that holds significance for traders, investors, and financial enthusiasts. Its importance lies in providing a robust set of tools and resources for analysing financial markets, sharing insights, and making informed decisions in the world of trading and investing. Let’s explore more about TradingView India.
What is TradingView?
TradingView Live is a powerful and popular web-based platform designed for traders and investors across various financial markets. It serves as a comprehensive tool offering real-time charts, technical analysis tools, and a community-driven environment for sharing trading ideas. This platform allows users to visualise market data, conduct in-depth technical analysis using a wide range of indicators and drawing tools, and create custom watchlists to monitor multiple financial instruments simultaneously.
One of its key features is the social networking aspect, enabling users to interact, share trading strategies, and collaborate within a vast community of traders, analysts, and investors. This network facilitates discussions, idea sharing, and the ability to follow and learn from experienced traders.
TradingView Live supports a wide array of financial instruments, including stocks, cryptocurrencies, forex, commodities market , and indices, offering users the flexibility to analyse and track multiple markets on a single platform. It provides access to both free and premium subscription services, each offering various features tailored to different user needs.
With its user-friendly interface, TradingView charts, real-time data, and collaborative community, this has become a go-to platform for traders and investors seeking market insights, technical analysis, and a platform to exchange ideas within the financial markets. Its versatility and accessibility make it a valuable resource for both novice and experienced market participants.
With its user-friendly interface, TradingView charts, real-time data, and collaborative community, this has become a go-to platform for traders and investors seeking market insights, technical analysis, and a platform to exchange ideas within the financial markets. Its versatility and accessibility make it a valuable resource for both novice and experienced market participants.
Benefits of Using TradingView
TradingView offers a multitude of benefits for traders and investors across various financial markets:
1. Advanced Charting Tools
TradingView Live provides a wide range of powerful and customisable charting tools. Users can access a variety of technical indicators, drawing tools, and chart types, allowing for in-depth analysis and comprehensive market insights.
2. Real-time Data and Market Coverage
The platform offers real-time data for a diverse set of financial instruments, including stocks, cryptocurrencies, forex, commodities, and indices. This extensive coverage allows users to track and analyse multiple markets simultaneously.
3. Social Networking and Collaboration
TradingView fosters a social community where traders, analysts, and investors can interact and share trading ideas, strategies, and insights. This collaborative environment enables learning, idea generation, and networking with experienced market participants.
Users can set up customisable alerts based on specific market conditions, price levels, or technical indicators. These alerts notify traders of potential opportunities or changes in the market, keeping them informed and responsive to market movements.
5. User-Friendly Interface
The platform boasts an intuitive and user-friendly interface, making it accessible for traders at all experience levels. Its simple navigation and easy-to-use features contribute to a seamless user experience.
6. Compatibility and Accessibility
TradingView is web-based and accessible across various devices, including desktops, laptops, tablets, and smartphones. This accessibility allows traders to access their charts, analyses, and community discussions from anywhere with an internet connection.
7. Backtesting and Strategy Development
Traders can backtest their trading strategies using historical data on TradingView. This feature allows users to assess the performance of their strategies in different market conditions before implementing them in live trading.
Integration with Brokerages
TradingView integrates with several brokerage firms, enabling users to execute trades directly from the platform with supported brokers.
Unlock Stock Market Opportunities with Religare Broking
Creating a chart on TradingView is a straightforward process that allows users to visualise market data and conduct technical analysis effectively:
1. Access TradingView
Log in to your account or sign up if you’re a new user. Once logged in, you’ll land on the platform’s homepage.
2. Select a Financial Instrument
Click on the “Chart” tab at the top of the screen. Choose a financial instrument by entering the symbol or name of the asset you want to analyse in the search bar.
3. Choose the Chart Type
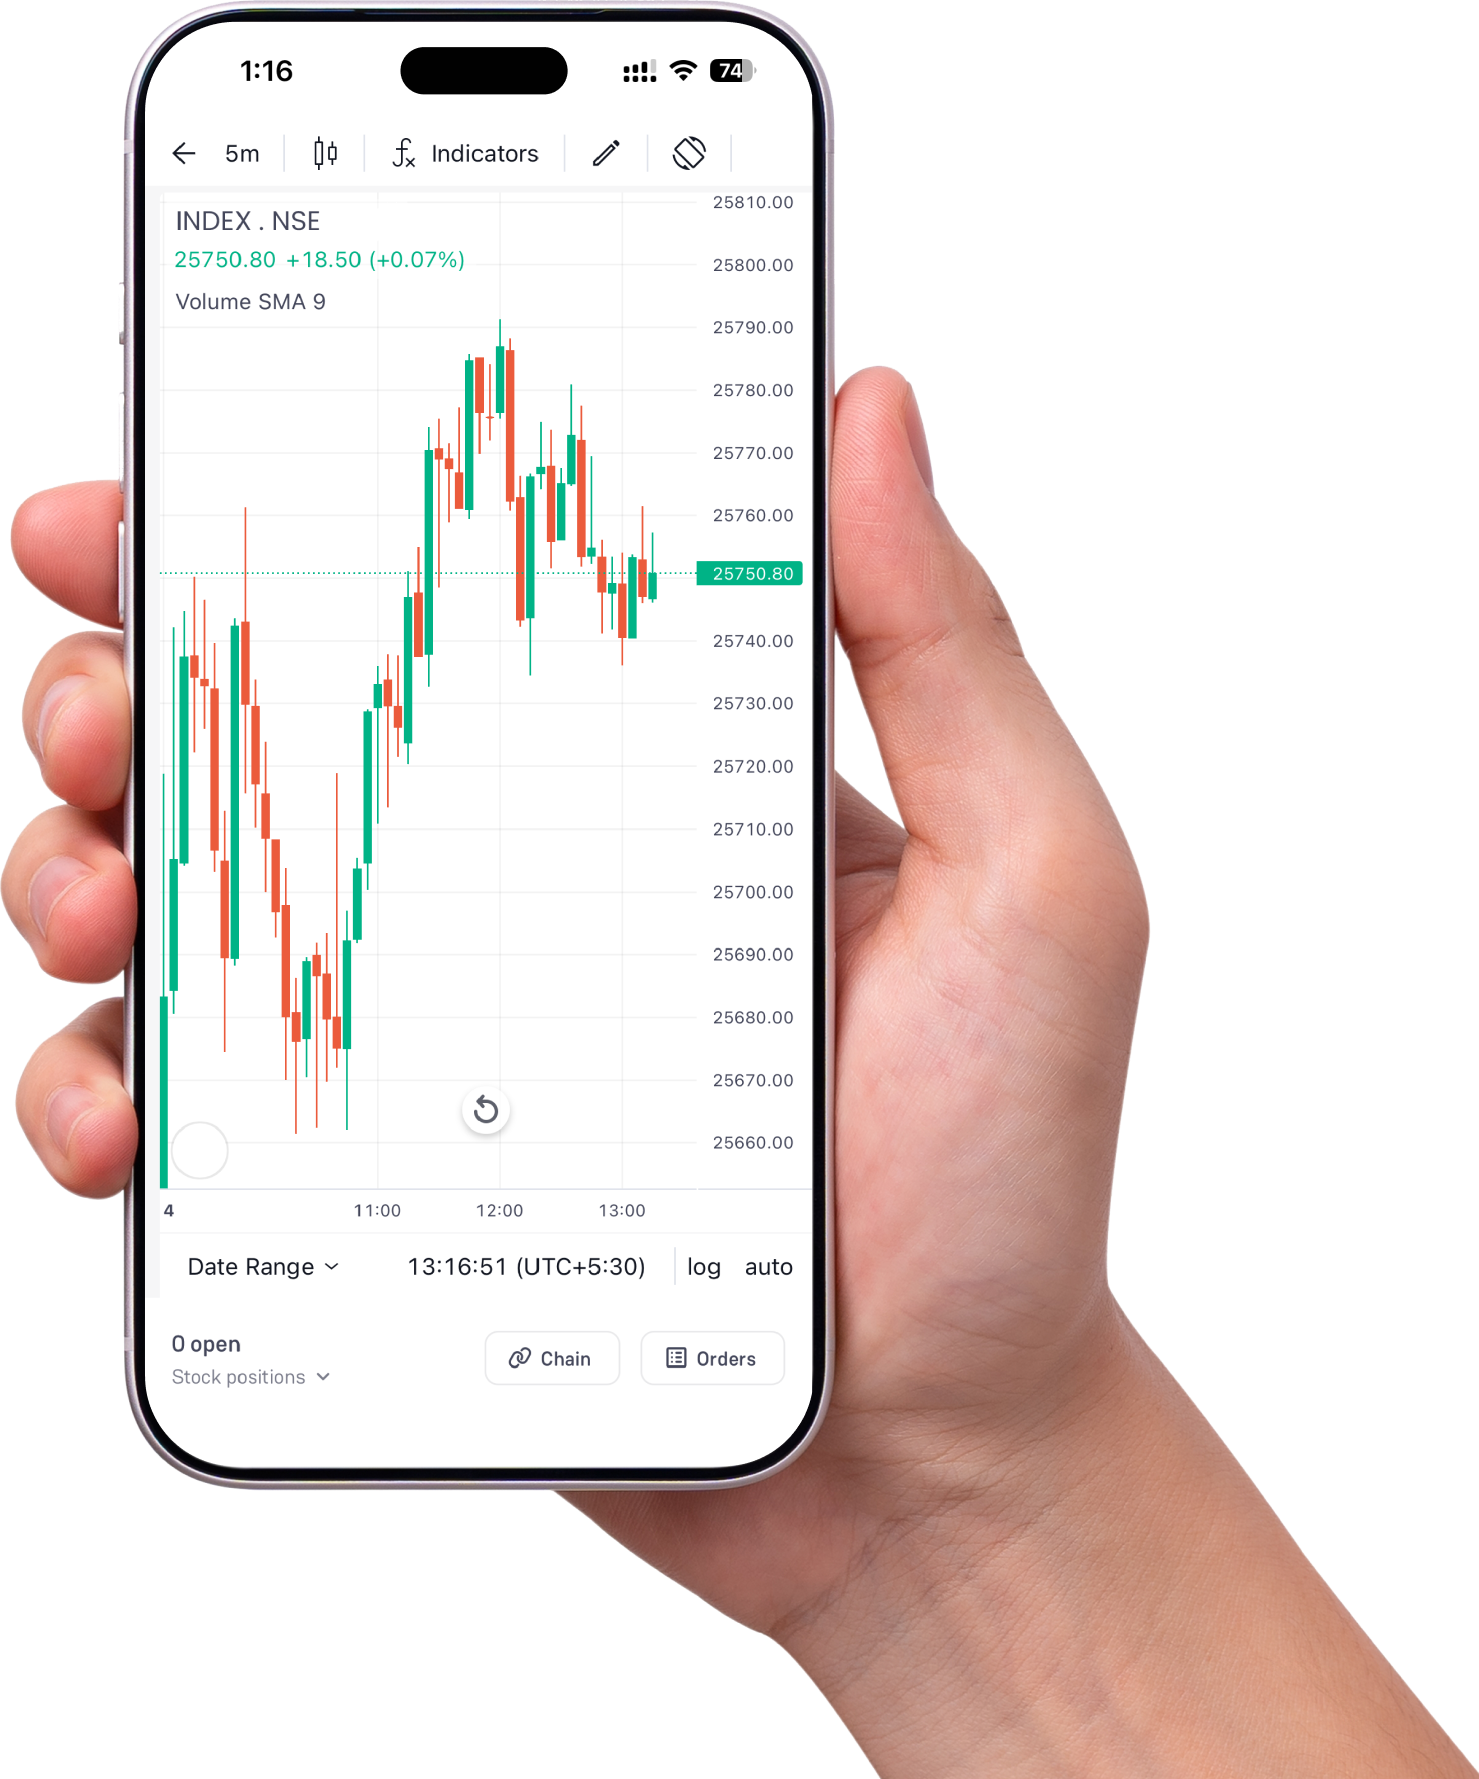
After selecting the financial instrument, choose the chart type ( candlestick , line, bar, etc.) from the toolbar located above the chart.
4. Add Technical Indicators and Drawing Tools
TradingView offers a wide range of technical indicators and drawing tools. To add indicators, click on the “Indicators” icon on the toolbar and select the desired indicators from the dropdown menu. To draw lines, shapes, or annotations, use the drawing tools available in the toolbar.
5. Customise the Chart
Users can customise the appearance of the chart by adjusting settings such as timeframes (1-minute, 5-minute, hourly, daily, etc.), chart style, background colour, and more using the settings menu on the top left corner of the chart.
6. Save and Share
Once you’ve created your desired chart with analysis and annotations, you can save it for future reference by clicking on the “Save” button. Additionally, TradingView allows users to share their charts or analysis with others by clicking on the “Publish” button and following the prompts to share publicly or with specific groups or followers.
7. Real-time Data and Updates
TradingView provides real-time data, ensuring that charts display the latest market information. The chart will update automatically with new price movements and data as they occur in the market.
How to Analyse a Chart on TradingView?
Any retail investor, financial professional, or investment firm can engage in trading. The ultimate goal of any trade is to buy stocks at a lower price and wait for the right time to sell them at a higher price. When you want to trade in the stock market, you may approach a financial advisor or open a Demat account online to handle it yourself. No matter how you place the buy or sell order, every trade on the stock exchange is now handled digitally.
How to Analyse a Chart on TradingView?
To analyse a chart on TradingView:
1. Select Financial Instrument
Choose the asset or financial instrument you want to analyse by entering its symbol or name in the search bar.
2. Choose Chart Type and Timeframe
Select the chart type (candlestick, line, etc.) and timeframe (1 hour, daily, etc.) to view historical price data.
3. Apply Indicators and Tools
Utilise technical indicators (Moving Averages, RSI, MACD, etc.) and drawing tools (trendlines, Fibonacci retracements, etc.) to perform analysis. Click on the “Indicators” and “Drawing Tools” icons on the toolbar to apply them.
4. Analyse Patterns and Trends
Identify chart patterns (head and shoulders , triangles, etc.) and trends to assess potential price movements or reversals.
5. Evaluate Support and Resistance Levels
Highlight key support and resistance levels to gauge potential entry or exit points.
6. Consider Volume and Market Sentiment
Assess trading volume and market sentiment indicators to validate analysis and potential trade opportunities.
7. Review Fundamental Factors
Additionally, consider fundamental factors and news that might impact the asset’s price movement.
By following these steps and combining technical analysis tools with market insights, traders can perform a comprehensive analysis to make informed trading decisions on TradingView India.
How to Trade on TradingView?
Trading on TradingView involves integrating with supported brokerages to execute trades directly from the platform. Follow these steps:
1. Connect a Brokerage
Ensure your chosen brokerage is compatible with TradingView. Go to the “Trading Panel” on the chart, select the “Broker” tab, and connect your brokerage account.
2. Access Trading Panel
Click on the “Trading Panel” icon on the chart to access the trading interface.
3. Select Asset and Order Type
Choose the financial instrument you want to trade and specify the order type (market, limit, stop, etc.).
Set the quantity, price, and other relevant parameters for the trade.
5. Review and Confirm
Review the trade details and confirm the order.
6. Monitor and Manage Trades
Once the trade is executed, monitor its progress and manage positions, setting stop-loss or take-profit levels as necessary.
Who Should Use TradingView?
TradingView Live caters to a diverse spectrum of users across the financial sphere. Primarily, it serves traders and investors involved in various markets, including stocks, cryptocurrencies, forex, commodities, and indices. These individuals seek a comprehensive platform offering advanced charting tools, real-time data, and technical analysis capabilities to make informed trading decisions.
Beyond seasoned professionals, TradingView India attracts financial enthusiasts keen on monitoring markets and learning about technical analysis. Its user-friendly interface and robust features cater to those seeking to stay informed about market trends, observe various financial instruments, and delve into the world of trading and investing.
Additionally, investment professionals, including portfolio managers, hedge fund managers, and financial advisors, leverage for investment research and decision-making. The platform’s tools and resources assist these professionals in conducting thorough analyses, tracking market movements, and identifying potential opportunities or risks within different asset classes.
Difference Between TradingView and Other Trading Platforms
Aspect
TradingView
Other Trading Platforms
Charting Tools
Offers extensive and customisable charting tools
Varies; some platforms may have limited charting options
Social Networking
Encourages a social community for idea-sharing
Limited social features
Accessibility
Web-based platform accessible across devices
May have platform-specific limitations
Broker Integration
Integrates with brokerages for direct trading
Varies; some platforms may offer different integrations
Free vs. Premium Access
Provides both free and premium subscription plans
Offerings and features may differ based on the subscription
Conclusion
TradingView emerges as a game-changer, offering traders a collaborative platform for analysis and direct trading integration with brokerage firms. Its robust tools, social networking, and accessibility cater to various market participants, empowering them with comprehensive insights for informed decision-making in the dynamic world of financial markets.
Related Knowledge Center
What is Trading?
What is Trading? Trading is the act of buying and selling financial instruments, like stocks, currencies, or commodities, with the goal of making a profit from price fluctuations within a specific timeframe. It is the fundamental law of every economic system. Any country’s growth capacity depends on the trade taking place in it. All kinds
Online Trading – A Beginner Guide With its digital prowess, online trading has transformed the financial landscape globally, and India is no exception. As technology evolves and markets become more accessible, the need for clear, concise information becomes paramount. Whether you’re a seasoned trader or just embarking on your trading journey, our comprehensive guide aims
National Commodity & Derivatives Exchange (NCDEX) The National Commodity & Derivatives Exchange is one of the most crucial aspects of Indian markets when it comes to trading commodities. Often referred to as the backbone of India’s commodity market, the platform plays a significant role in providing a transparent and secure marketplace for traders and investors