Best Buy and Sell Indicator TradingView: How to Use?
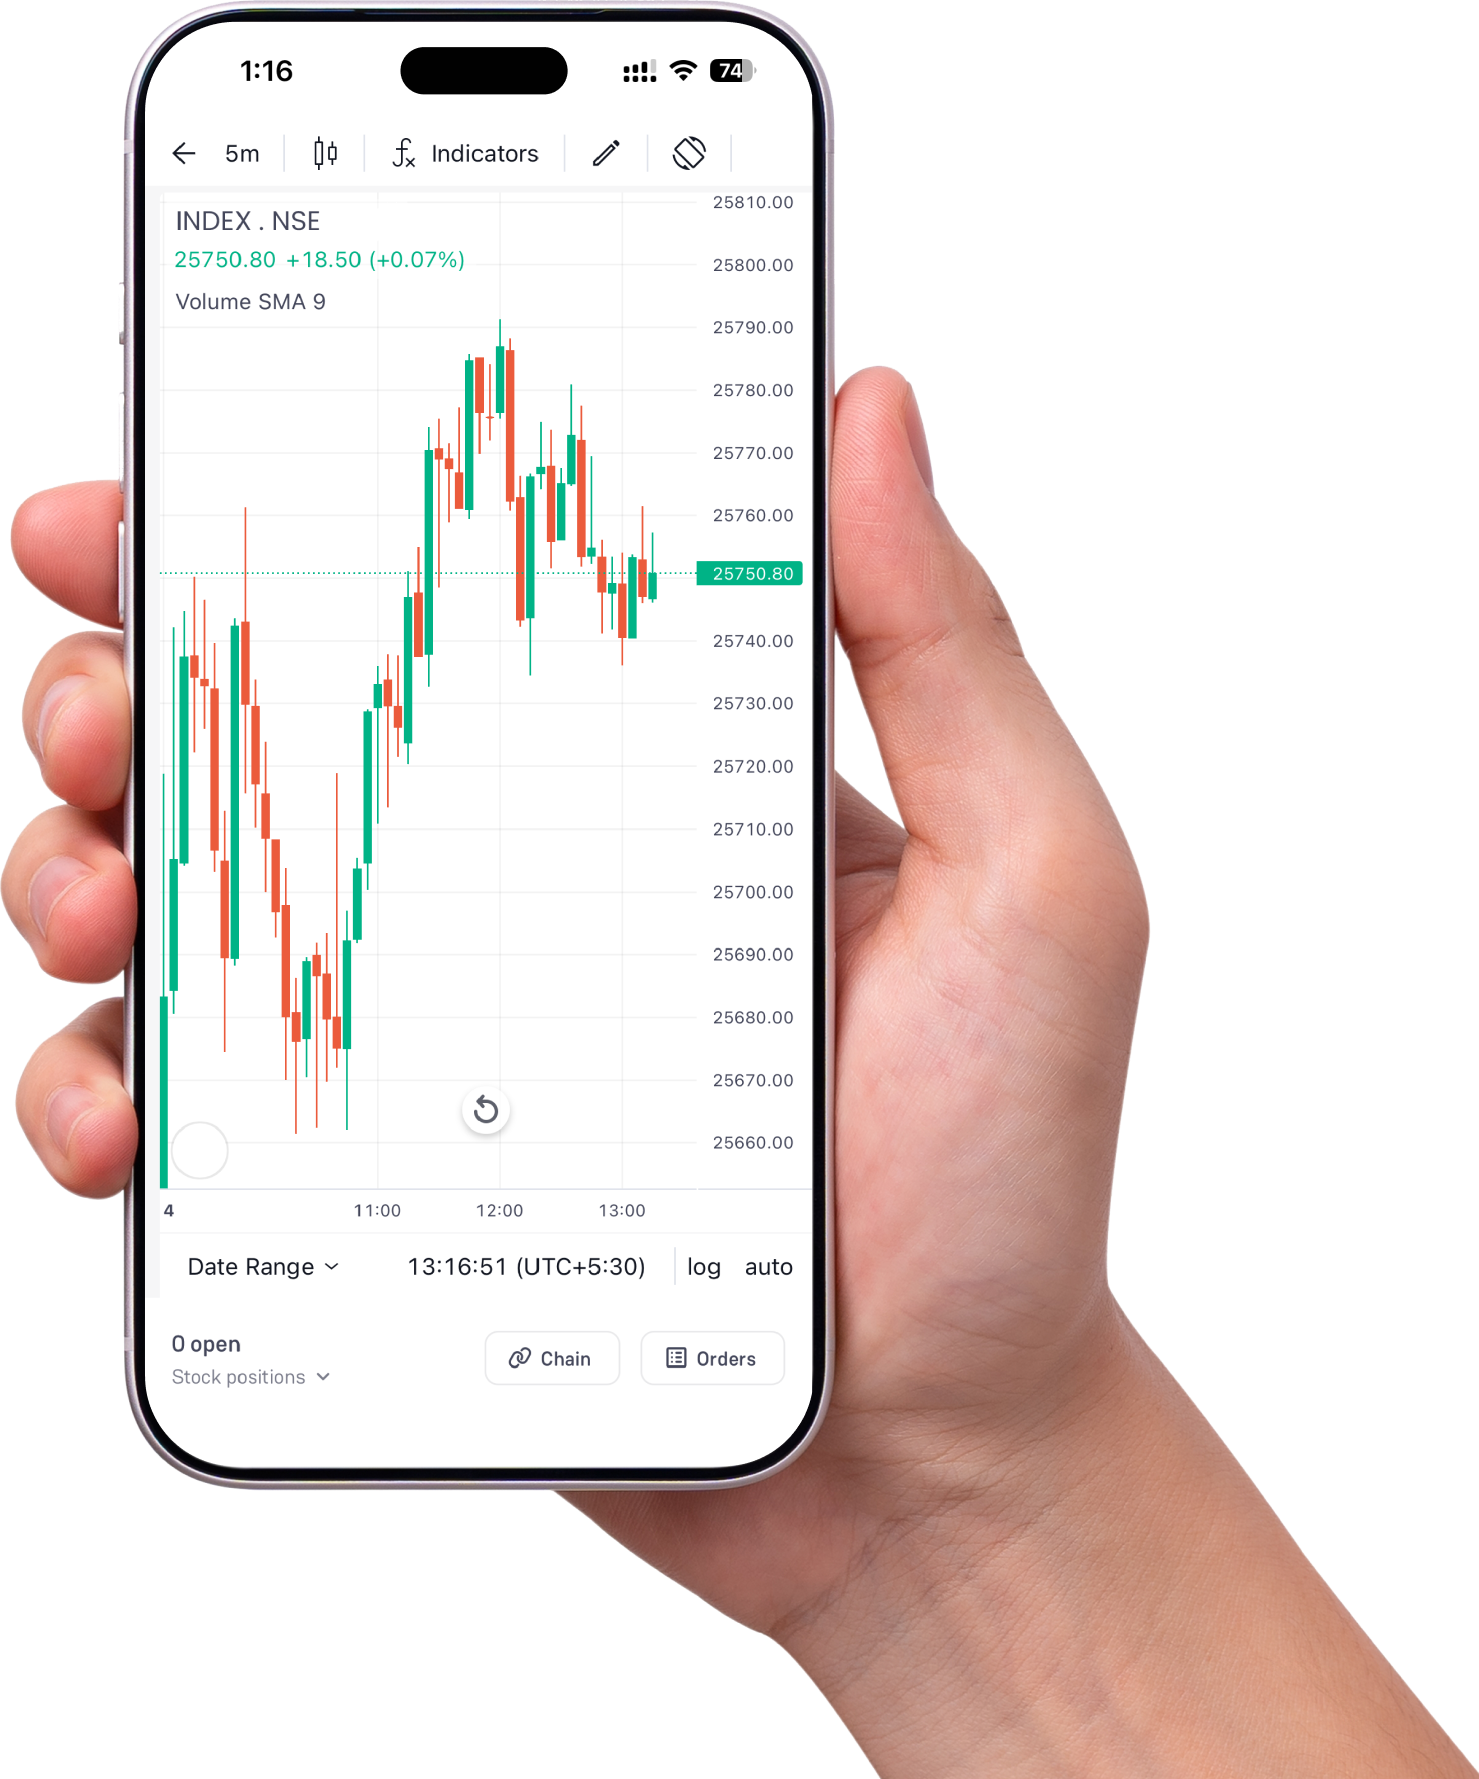
TradingView is one of the most widely used charting software in the stock market, allowing traders and investors to use the various tools and indicators to analyse the market conditions and trade accordingly. Most of the brokers use and integrate TradingView into their online trading platforms.
Apart from candlestick chart patterns, in TradingView, you can apply various types of useful indicators used in technical analysis to identify the stocks that have potential to trade. You can use the indicators to find the buying or selling point with signal giving ability to book profits or exit from your trade position.
Here, we are going to discuss the best buy and sell indicators in TradingView with its applications in various market conditions. These indicators will help you to find the most suitable buying and selling points in various market conditions for individual stocks, or indices and underlying securities in the derivatives market.
How to Identify Buy and Sell Signals in TradingView?
To identify the entry and exit points in TradingView, you need to analyse the market trend and technical chart of the individual stock using the tools and indicators. There are various indications or signals that can be used to decide the buying and selling points in TradingView.
The buy and sell indicator in TradingView combines the price action, momentum and volume of trade. However, to identify the buying and selling points, you can use the following indications.
- Support & Resistance: The support and resistance levels are the strong base points where the market pulls back in the upward and downward direction, respectively, due to strong buying and selling actions by the traders. When the market or stock price reaches these support levels, it is a buying opportunity for the traders. Similarly, when market or stock price touches the resistance levels, the price resists and likely to turn back, giving the selling opportunity for the traders.
- Breakouts & Breakdowns: Breakouts happen at resistance levels where the market or individual stock price stops, but when this resistance breaks, a bullish trend gives the buying opportunity to traders. Similarly, at the support levels, the market stops, but when it breaks down due to high selling pressure, it creates an ideal opportunity for the traders to enter into a short position or book profit from the short-sell trade position.
- Change in Open Interest Data: The change in the open interest data in the derivatives market can also help you decide the buying or selling point in the market. The combination of change in open interest and price change gives the bullish and bearish trend in the market, giving the buying or selling opportunities.
- Price and Chart Patterns: The movement in the price creates a series of various candlestick chart patterns in TradingView, which also gives a relevant signal of buying or selling for the traders. When price action is accompanied by candlestick chart patterns, the technical indicators can be used to confirm the buy or sell signals.
Most Accurate Buy Sell Indicator in TradingView
The buying or selling indicator in TradingView can be used to identify the potential of entering into a long or short trade position at various points. Some of them work on the price movement, some of them on the trading volume activity, while a few of them work in combination of both of them.
However, finding the most accurate indicator is difficult due to unpredictable market conditions, but they can give a signal that you can confirm with other indicators to ensure the trend. Let’s find out what the indicators in TradingView are that you can use for buying and selling decisions.
Relative Strength Index
RSI measures the speed and change of price movement that oscillates between 0 and 100. When RSI falls below 30, it indicates that the stock may be trading in the oversold zone and is expected to bounce back. Here, you can use the RSI value as a buying signal if trading below 30 to enter into a long trade position.
Similarly, when RSI is trailing above 70, it gives the signal that the stock price is trading in an overbought zone and likely to fall back. Here, with the turnaround of price, you can enter into a short-sell or book profit in your long position. RSI can trail between the 30-70 values unless strong reasons push the market into a new trend.
Supertrend Indicator
You can use this indicator to identify the entry or exit points in the stock. When the market index or stock price moves above the SuperTrend line, it gives a signal to enter into a long trade position. Similarly, when the price is below the SuperTrend line, it gives the indication of a bearish trend with the signal to enter into a short position.
SuperTrend is a highly flexible indicator that can adjust the dynamic support and resistance levels as per the market volatility. And you can also use the candlestick chart patterns with different time frames to draw the Super Trend line and identify the accurate potential entry and exit points.
Bollinger Bands
Bollinger Bands in TradingView can help you gauge the volatility in the stock. The combination of three bands in this indicator shows the support and resistance with the range of volatility in the market. The expansion of bands moves them away from each other, indicating the volatility in the market.
Similarly, when bands move closer and contract, they indicate low volatility in the underlying security. Here, when the upper and lower bands squeeze together, it shows low volatility, giving an excellent opportunity to buy the stock. And when the band expands, it indicates rising market volatility, you can exit from your trade position or short-sell.
Moving Average Crossover
Defined from the average price of stock with different weightage to identify the support and resistance levels in the market of an individual stock. Simple Moving Average (SMA) and Exponential Moving Average (EMA) are two types of moving averages used to identify the market trend with buy or sell signals.
Here you can use the crossover of the moving average lines to enter into a long or short trade position. When the 50-day MA crosses the 200-day MA from above, it is a bullish trend, giving you an opportunity to enter into a trade position. Similarly, when the 50 MA crosses below the 200-day MA, it indicates a downward momentum, giving an opportunity to either exit from your trade position or short sell.
Moving Average Convergence Divergence
MACD is another useful technical indicator in TradingView that can be used to get the buy and sell signals in the market. It shows the relationship between the two exponential moving averages (EMAs) of a stock price, with two lines: the MACD line and signal line (EMA line).
Also Read: RSI and MACD: Powerful Indicators for Stock Traders
Here, the crossover of the MACD line with the single line (EMA line) is a crucial point to enter into a buy or sell position. Interpreting the convergences and divergences is the right way to use the MACD indicator. You can buy the stock or enter into a long position when the MACD line crosses above the signal line, and sell the stock or go short in the market when the MACD line crosses below the signal line.
Fibonacci Retracement
This indicator is useful in finding the best support and resistance levels of the stock price or market index, showing the levels where the market can take corrections. The commonly used Fibonacci Retracement levels are 23.6%, 38.2%, 50%, 61.8%, and 78.6%.
These retracement levels work as support and resistance that suggest the buying and selling points when the price reaches these retracement levels. However, if the price breaks through the retracement levels, it shows a strong indication of further continuation of the trend.
Custom Volatility Breakout
This indicator is useful when the market is highly volatile, making it difficult for traders to find the entry and exit points into the new trade positions. But using the custom volatility breakout indicator, you can identify the potential exit points based on the changes in the volatility in the market.
This indicator helps to identify when the market transitions from the consolidation phase to a strong direction. And using the combination of other indicators like Average True Range (ATR) and Volume Spikes, you can determine the buying and selling points in your stock or underlying security.
Conclusion
In TradingView, you can find various technical indicators as per your trading strategy. And many of them can be used as Buy Sell TradingView indicators , either individually or in combination with other indicators. The most ideal way to identify the buy and sell signal is to identify the support and resistance, use the breakout & breakdown or interpret the change in open interest data and price movement on candlestick chart patterns.
In TradingView, you find and use RSI, MACD, Moving Averages, Bollinger Bands, Fibonacci Retracement and Supertrend Indicator for identifying the buy and sell signal in the market or targeted underlying security. However, relying on any one of them individually can give a false signal, hence always use them in combination to confirm the trend and take the right decision to enter into long or short trade positions.
Frequently Asked Questions (FAQs)
What is the most accurate buy and sell indicator on TradingView?
While no indicator is 100% accurate, the Supertrend, UT Bot Alerts, and LuxAlgo are widely considered the best buy and sell indicators on TradingView. For the highest accuracy, traders combine them with a momentum oscillator like the Relative Strength Index (RSI) or MACD to filter out false signals during choppy, sideways markets.
How do I get buy and sell signals on TradingView?
To get buy and sell signals on TradingView, open a chart, click the “Indicators” tab at the top, and search for a signal-based indicator like “Supertrend” or “UT Bot Alerts.” Once added, click the three dots next to the indicator name on your chart and select “Add alert” to get real-time pop-ups, emails, or phone notifications when a buy or sell signal triggers.
Do TradingView indicators repaint?
Some community-created scripts on TradingView do “repaint,” meaning they retroactively alter past buy or sell signals after the price candle closes to make the indicator look perfectly accurate. To avoid this, always use non-repainting indicators and look for a “Non-Repainting” tag or verification in the script’s description.
Are buy and sell indicators on TradingView free?
Yes, thousands of highly effective buy and sell indicators are completely free on TradingView. Built-in tools like the Supertrend, Moving Average Cross, and thousands of open-source, community-created scripts can be added to your chart without a paid subscription. Premium, invite-only suites (like LuxAlgo or MarketCipher) require external paid memberships.