How to Read Candlestick Charts for Intraday Trading?

Understanding how to read candlestick charts for intraday trading is crucial for any trader aiming to navigate the stock market efficiently. Candlestick charts visually represent price movements over a specific period, offering insights into market sentiment and potential price direction. This guide will explain the essentials of reading and analysing candlestick charts for effective intraday trading.
Topics Covered :
- What are Candlestick Charts?
- How to Analyse Candlestick Charts?
- Candlestick Chart Patterns
- Conclusion
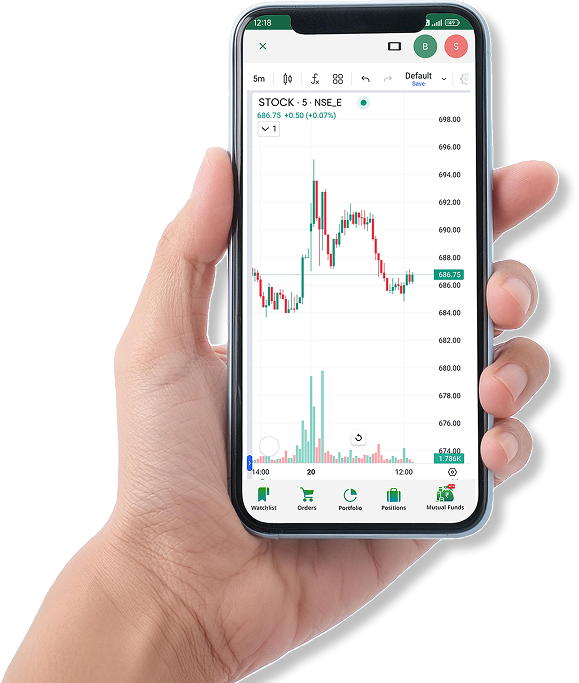
What are Candlestick Charts?
Candlestick charts charts are a popular tool used in the stock market to display price information over time. Each candlestick represents four key data points: the open, high, low, and close prices for a given period. The body of the candlestick indicates the price range between the open and close. At the same time, the wicks or shadows show the highest and lowest prices during the period.
Originating from Japanese rice traders, candlestick charts have become crucial in modern trading due to their ability to convey complex information in a simple visual format. They help traders understand market psychology and identify potential trading opportunities.
Begin your investing journey today. Your Demat account is the first step.
How to Analyse Candlestick Charts?
To effectively analyse candlestick charts, traders must understand the basic structure and what each part represents. Here’s a step-by-step guide on how to read candlestick charts for intraday trading:
1. Identify the Components: Each candlestick has a body and wicks (or shadows). A long body indicates strong buying or selling pressure, while short bodies suggest consolidation.
2. Colour Coding: Traditionally, green or white candlesticks indicate a closing price higher than the opening price (bullish), while red or black candlesticks show a closing price lower than the opening price (bearish).
3. Wick Analysis: The length of the wicks can provide additional insights. Long upper wicks indicate selling pressure, while long lower wicks suggest buying pressure.
4. Pattern Recognition: Recognise common candlestick patterns such as doji, hammer, and engulfing. These patterns can signal potential market reversals or continuations.
Analysing candlestick charts involves understanding and interpreting these elements within market trends and other technical indicators.
Candlestick Chart Patterns
Understanding how to read candlestick charts for intraday trading is essential for anyone navigating the stock market effectively. Candlestick charts visually represent price movements over time, providing traders with valuable insights into market sentiment and potential price direction. Below, we explore key candlestick patterns that every intraday trader should know.
Bullish Engulfing
A bullish engulfing pattern occurs when a small bearish candle is followed by a larger bullish candle, completely engulfing the previous candle’s body. This suggests buyers have taken control, indicating a potential reversal from a downtrend to an uptrend.
Doji
A doji forms when the opening and closing prices are virtually the same, creating a small or non-existent body. This pattern signals indecision in the market. Depending on its position, it can indicate a potential reversal, particularly when found at the top or bottom of trends.
Hammer
Found at the bottom of a downtrend, the hammer candlestick pattern has a small body and a long lower wick. This pattern indicates that despite sellers driving prices down, buyers managed to push prices back up, suggesting a potential bullish reversal.
Dark Cloud Cover
This bearish reversal pattern features a bullish candle followed by a bearish candle that closes below the midpoint of the previous candle. It indicates that sellers have taken over, and a downtrend might follow.
Evening Star
The evening star candlestick pattern is a bearish reversal pattern consisting of three candles. It starts with a large bullish candle, then a small-bodied candle, and ends with a large bearish candle. This formation suggests that buying momentum is weakening, and sellers are taking control.
Hanging Man
This pattern appears at the top of an uptrend and has a small body with a long lower wick. It indicates a potential bearish reversal, as it shows that sellers were able to drive prices down during the session, even though buyers pushed them back up by the close.
Morning Star
The morning star candlestick pattern is a bullish reversal pattern that occurs after a downtrend. It consists of three candles: a bearish candle, a small-bodied candle, and a bullish candle. This pattern suggests that selling pressure is subsiding, and buyers are gaining control.
Piercing Pattern
This bullish reversal pattern starts with a long bearish candle followed by a bullish candle that closes more than halfway up the previous candle. It indicates that the buying pressure is strong enough to reverse the downtrend.
Spinning Top
Characterised by small bodies and long wicks, spinning tops indicate indecision in the market. Depending on the preceding candles, this pattern can signal potential reversal points or a continuation of the current trend.
Three Black Crows
This bearish pattern consists of three consecutive long bearish candles, each closing lower than the previous one. It suggests strong selling pressure and a potential continuation of the downtrend.
Three White Soldiers
This bullish pattern features three consecutive long bullish candles opposite the Three Black Crows. Each candle opens within the previous candle’s body and closes higher, indicating strong buying pressure and a potential continuation of the uptrend.
Rising Three Methods
This bullish continuation pattern involves three small bearish candles between two long bullish candles. It indicates that the uptrend will likely continue after a brief consolidation period.
Bearish Harami
This pattern shows a small bearish candle within the range of the previous large bullish candle, signalling a potential bearish reversal. It suggests that the buying pressure is weakening, and sellers might take control.
White Marubozu
A white marubozu is a bullish candle with no wicks. It indicates that prices opened at the low and closed at the high of the session. This pattern shows strong buying pressure and suggests a continuation of the uptrend.
Three Inside Up
This bullish reversal pattern starts with a small bearish candle followed by a larger bullish candle that engulfs the previous one and another bullish candle. It indicates that the downtrend might be reversing.
Additionally Read: What is Demat Account?
Bullish Harami
The opposite of the Bearish Harami, this pattern shows a small bullish candle within the range of the previous large bearish candle, suggesting a potential bullish reversal.
Inverted Hammer
Found at the bottom of a downtrend, the inverted hammer has a small body and a long upper wick. It indicates buyers tried to push prices up but faced resistance, yet the buying pressure might continue.
On Neck Pattern
A bearish continuation pattern, the on-neck pattern shows a bearish candle followed by a smaller bearish candle that closes near the previous candle’s low. The downtrend will likely continue.
Double Candlestick Patterns
These patterns involve two candles and can indicate potential market reversals. Examples include the Engulfing and Harami patterns, which signal shifts in market sentiment and potential changes in price direction.
Recognising these candlestick types can help traders make more informed decisions in the stock market.
Conclusion
Understanding how to read candlestick charts for intraday trading is a vital skill for traders. By mastering candlestick patterns and analysis techniques, traders can gain valuable insights into market trends and potential trading opportunities. Open a free demat account today to apply these strategies in your trading endeavours.