Relative Strength Index
The Relative Strength Index (RSI) is a momentum indicator to evaluate whether an asset is overbought or oversold. It measures the speed and change of price movements to help traders identify potential market reversals. RSI signals when an asset’s price has moved too far, either up or down, indicating a possible price correction.
How the Relative Strength Index Works
The Relative Strength Index (RSI) works by analysing price movements to determine the strength of a trend. It compares the magnitude of recent gains to losses, helping traders gauge whether an asset is nearing overbought or oversold levels. This comparison aids in identifying potential market reversals. When the RSI value rises above 70, the asset might be overbought, while readings below 30 suggest it could be oversold.
Formula for Calculating RSI
The formula for calculating RSI is as follows:
RSI = 100 – [100 / (1 + (Average Gain / Average Loss))]
Where:
- Average Gain is the average of all gains over the selected period.
- Average Loss is the average of all losses over the selected period.
This formula helps to calculate the RSI by measuring the average gains and losses in a specific time frame.
Importance of the Relative Strength Index
The Relative Strength Index (RSI) is vital for traders as it helps to identify potential market reversals by indicating overbought or oversold conditions. It enables investors to make informed decisions, timing their buys and sells based on price momentum and assessing the strength of a prevailing trend.
Conclusion
RSI is an essential tool for traders, providing valuable insights into market conditions. By understanding its readings, traders can pinpoint optimal buy and sell opportunities, making more strategic decisions and enhancing their trading success. It’s a key indicator for effective market analysis and informed decision-making.
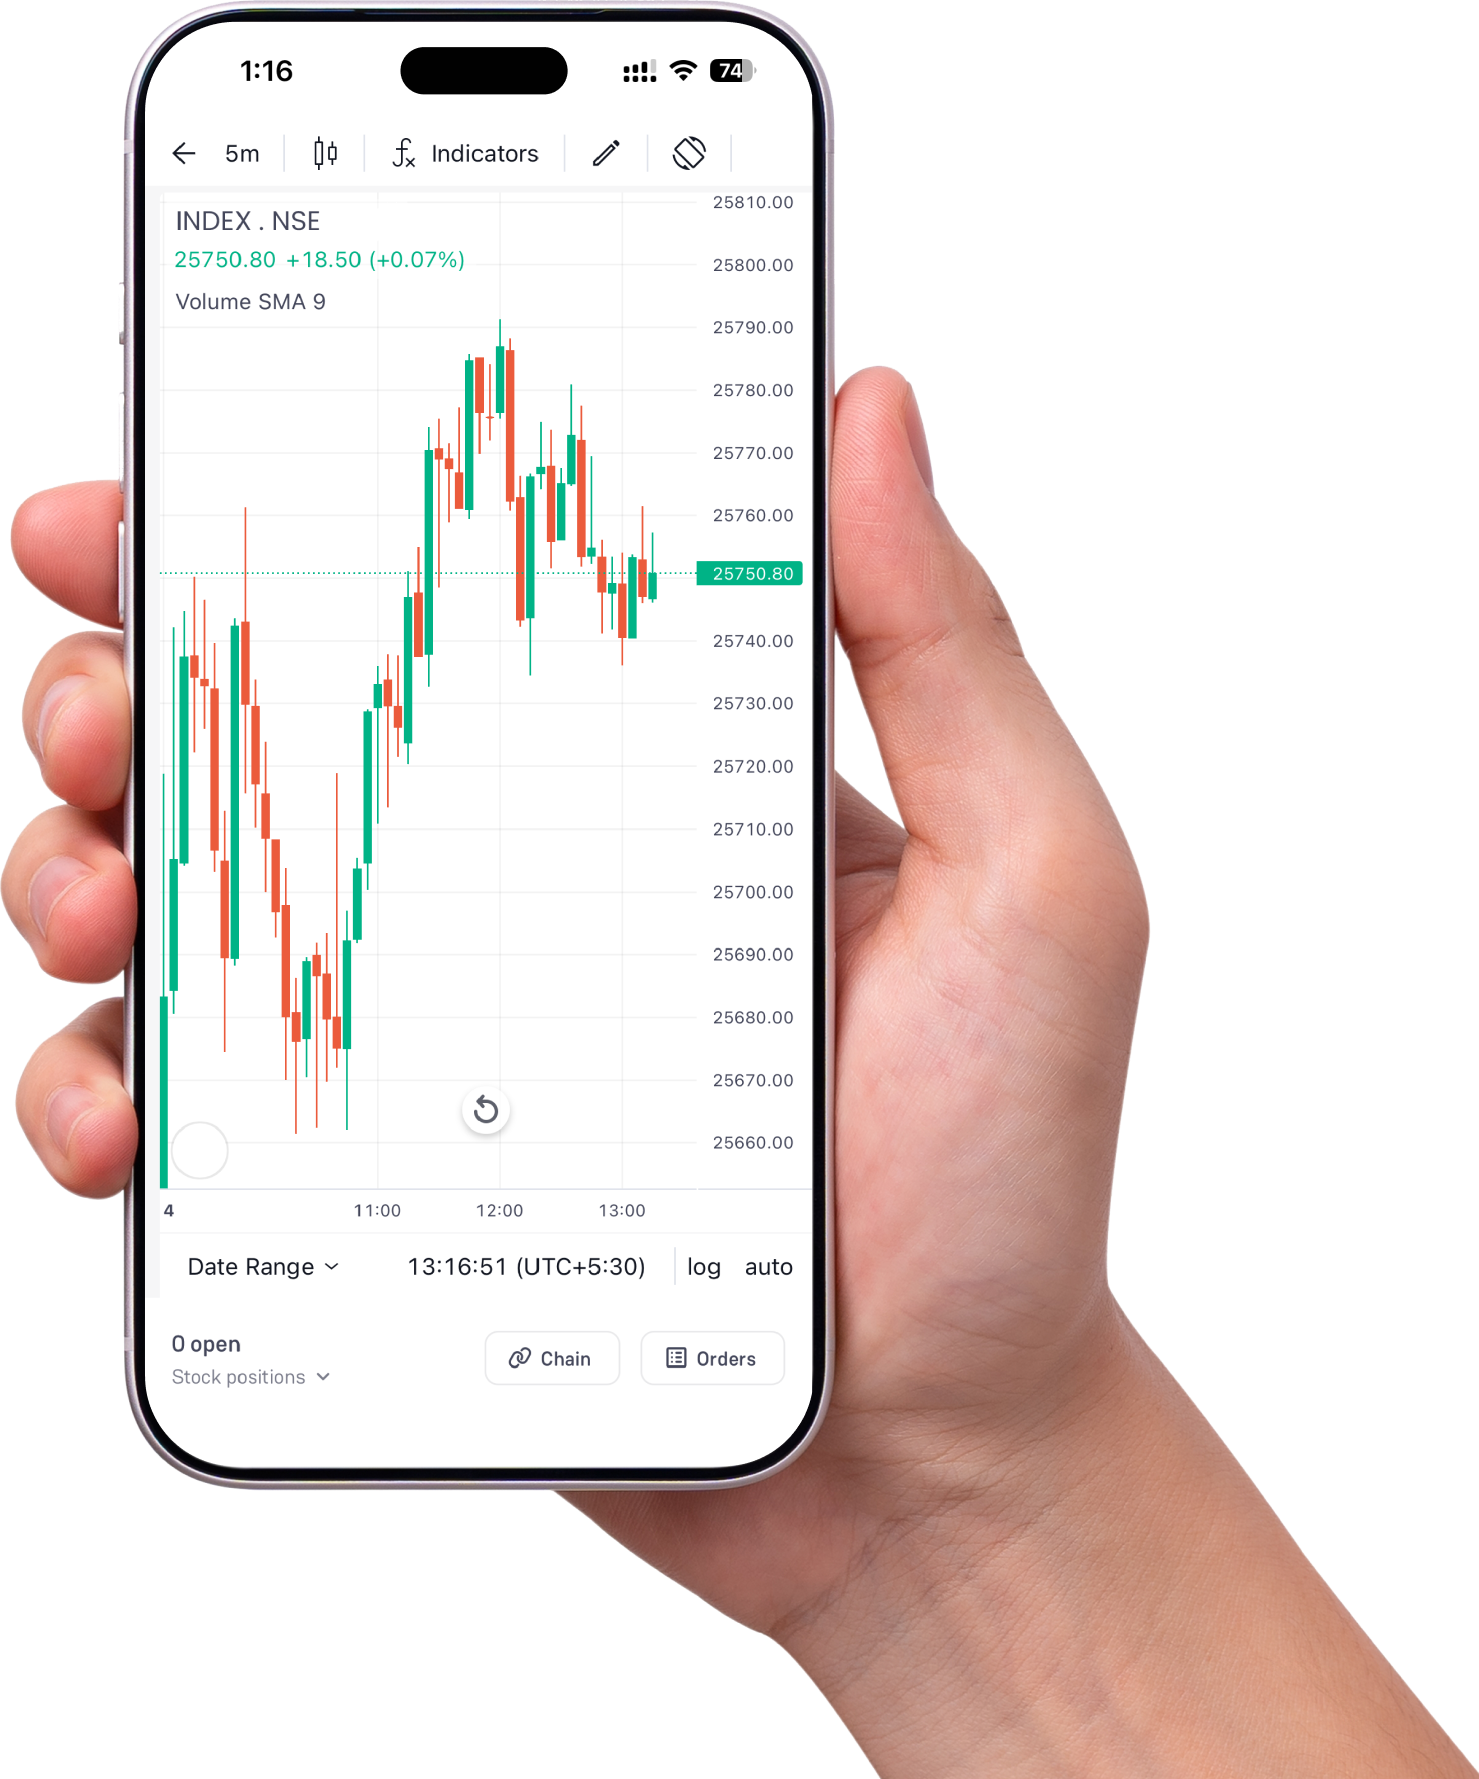
Trade Anytime,
Anywhere
Experience India's seamless trading app with advanced features, intuitive design, and lightning-fast execution.
Unified Portfolio
All Assets, One App
Instant Market Alerts
Live Research, Zero Delay
Seamless Security
Biometric Login for Safe Trading
Actionable Ideas
Pre-built Options Strategies
Based on 27.4K reviews
1M+
Downloads