Best Time for Intraday Trading in India

Intraday or day trading is a popular form of trading in the Indian stock market. It involves buying and selling securities within a single trading day, aiming to profit from short-term price fluctuations. However, because intraday trading is quick, you must understand the best time to enter and exit the market.
This can greatly impact the success or failure of a trader’s strategies. This guide will discuss the best time for intraday trading in India, considering the various factors that affect the market. From market timings to volatility and liquidity, we will provide insights and tips to help traders make informed decisions and maximise their profits.
What is Intraday Time Analysis?
Intraday time analysis is crucial for intraday traders. Traders employ this method to examine patterns and movements within the trading day to inform their decision-making process.
Traders can identify potential trade entry and exit points by closely analysing the price movements and volume trends within specific time frames. This analysis helps traders understand the market dynamics and identify key support and resistance levels within the trading day.
To conduct intraday time analysis effectively, traders use various tools and indicators such as
candlestick charts, moving averages, and oscillators like the Relative Strength Index (RSI) or Stochastic Oscillator.
These tools provide valuable insights into market trends and price momentum, aiding traders in predicting potential market movements and making informed trading decisions.
By leveraging intraday time analysis and utilising the appropriate tools and indicators, traders can improve their chances of success in the volatile world of intraday trading.
Also Read: How to choose stocks for intraday trading
Begin your investing journey today. Your Demat account is the first step.
Importance of Timing in Intraday Trading
Timing plays a critical role in India’s intraday trading. The specific hours of the trading day can greatly impact volatility, liquidity, and potential returns for traders. Understanding the characteristics of different intraday trading times is important to maximise the chances of success.
To illustrate the impact of timing, let’s take a closer look at the characteristics of various trading periods throughout the day through a table:
| Time Slot | Characteristics | Volatility | Liquidity |
| Opening Hour (9:15-10:15 AM) | High volatility, opportunity for quick gains | High | High |
| Mid-day Lull (12:00-1:00 PM) | Lower volatility, less trading volume | Low | Medium |
| Closing Hour (2:30-3:30 PM) | Increased volatility, closing positions | High | High |
The Best Time Frame for Intraday Traders
For intraday traders in India, understanding the best time frames for trading is essential to maximise their chances of success. The stock market exhibits different characteristics at various times of the day, impacting volatility and liquidity, which are crucial factors for intraday trading strategies.
The market opens at 9:15 AM, and the first hour, known as the opening hour, is marked by high volatility and liquidity. This period is often considered the most profitable for intraday traders because the overnight news and events are reflected in the price movements. Traders can take advantage of these quick gains due to the significant price fluctuations.
However, the market stabilises as the day progresses, leading to a mid-day lull around 12:00 PM to 1:00 PM. During this time, volatility is lower, and there’s less trading volume, making it less ideal for large trades. The liquidity is medium, so traders might find it more challenging to execute large orders without affecting the price.
The last hour of trading, from 2:30 PM to 3:30 PM, shows an increase in volatility and liquidity as traders begin to close their positions. This period, like the opening hour, offers opportunities for profit due to traders’ urgency to settle their positions before the market closes.
Ultimately, the best time frame for intraday trading in India depends on various factors, including personal trading style, risk tolerance, and market conditions. Traders must analyse historical data, monitor market opening hours, and consider the level of volatility during different periods to determine the most advantageous trading times for their strategies.
Recommended Read: Trading vs. Delivery
Types of Intraday Trading Charts
Line Charts
Line charts are the simplest and most basic type of chart used in intraday trading. They plot the closing prices of a security over a specified period, connecting the data points with a line. Line charts provide a clear visual representation of the overall price trend, making it easy for traders to identify patterns and trends in the market.
Bar Charts
Bar charts provide more detailed information than line charts. They display the underlying security’s high, low, open, and close prices for each time frame. Each bar on the chart represents a specific time frame, with the vertical line indicating the price range and the horizontal lines indicating the opening and closing prices. Bar charts allow traders to analyse price volatility and the relationship between opening and closing prices.
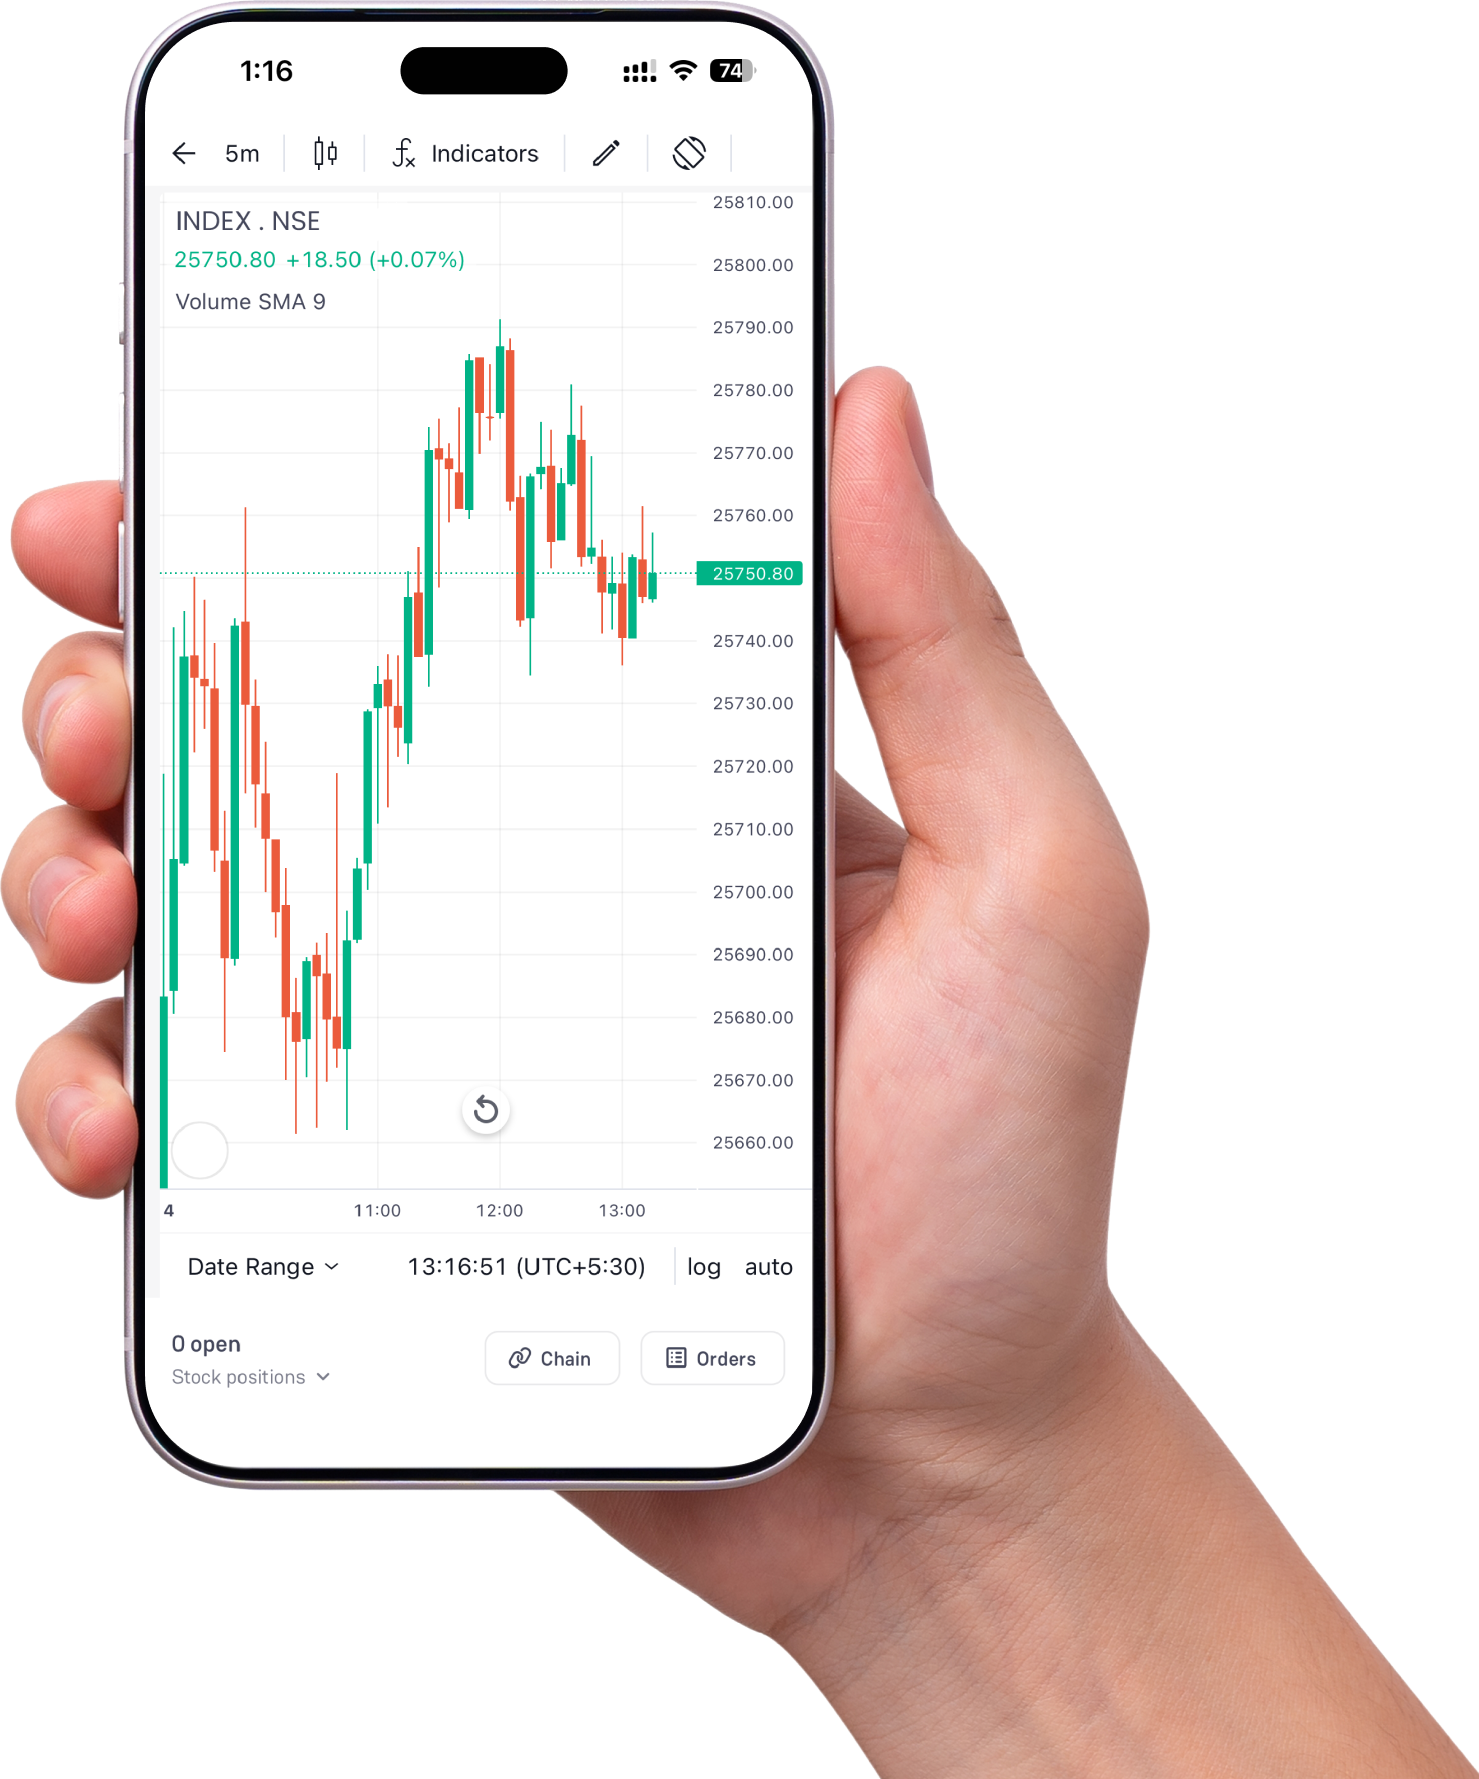
Candlestick Charts
Candlestick charts are widely used in intraday trading because they provide detailed information and patterns. Each candlestick represents a specific time and displays the opening, closing, high, and low prices.
The candlestick’s body is filled or hollow, indicating whether the closing price is higher or lower than the opening price. Candlestick charts reveal market sentiment, allowing traders to identify price reversals, trends, and key support and resistance levels.
Conclusion
As discussed in this guide, the best time for intraday trading is during the first hour of market opening and the last hour before closing. However, analysing market trends and considering individual risk tolerance is important before making any trading decisions. With proper research and discipline, investors can maximise intraday trading and achieve their financial goals. Happy trading!
Start Intraday Trading with a Demat Account and Maximise Your Profit Potential Today! Open Demat Account now