Candlestick Patterns for Trading
Understanding Candlestick Patterns in Stock Market Trading
Candlestick charts provide valuable insights to investors about the market’s behavior.In this blog post, we’ll explore the importance of understanding candlestick patterns, their basic components, and various types of candlestick patterns. We’ll also discuss how to interpret candlestick patterns, using them in trading strategies, common mistakes to avoid, and their application in different markets.
Topics Covered
- Understanding Candlestick Charts
- Types of Candlestick Patterns
- Interpreting Candlestick Patterns
- Technical analysis using Candlestick Patterns
- Common Mistakes in Using Candlestick Patterns
- Candlestick Patterns for Different Markets
- Advanced Candlestick Patterns
- Candlestick Pattern Tools and Resources
- Combining Candlestick Patterns with other technical indicators
- Conclusion
Understanding Candlestick Charts
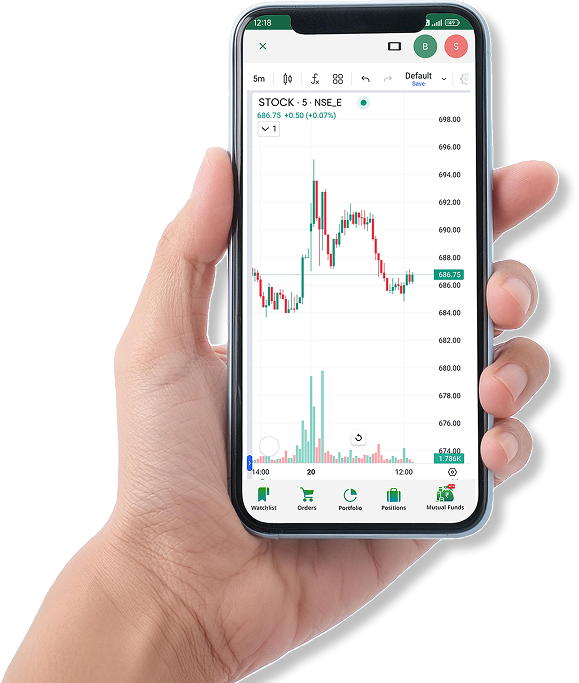
Candlestick charts are a popular charting technique used in technical analysis. They display the open, high, low, and close prices for a given period, providing a comprehensive picture of the market’s behavior. A candlestick chart consists of a real body, upper shadow, and lower shadow. The real body represents the difference between the open and close prices, while the shadows show the high and low of the trading session.
Begin your investing journey today. Your Demat account is the first step.
Types of Candlestick Patterns
Candlestick patterns can be classified as bullish, bearish, and neutral patterns. Bullish patterns indicate a potential uptrend, while bearish patterns suggest a possible downtrend. Neutral patterns imply that the market is in an indecisive or consolidation phase.
Bullish candlestick patterns include the hammer, bullish engulfing, piercing line, and morning star. The hammer pattern consists of a small real body and a long lower shadow, indicating a potential bullish reversal. The bullish engulfing pattern occurs when a small bearish candlestick is followed by a larger bullish candlestick, indicating a potential bullish reversal. The piercing line pattern occurs when a bearish candlestick is followed by a bullish candlestick that opens below the previous day’s low but closes above the midpoint of the previous day’s real body. The morning star pattern consists of a long bearish candlestick, a small real body, and a long bullish candlestick, indicating a potential bullish reversal.
Bearish candlestick patterns include the shooting star, bearish engulfing, dark cloud cover, and evening star. The shooting star pattern occurs when a small real body and a long upper shadow appear at the top of an uptrend, indicating a potential bearish reversal. The bearish engulfing pattern occurs when a small bullish candlestick is followed by a larger bearish candlestick, indicating a potential bearish reversal. The dark cloud cover pattern occurs when a bullish candlestick is followed by a bearish candlestick that opens above the previous day’s high but closes below the midpoint of the previous day’s real body. The evening star pattern consists of a long bullish candlestick, a small real body, and a long bearish candlestick, indicating a potential bearish reversal.
Neutral candlestick patterns are doji and spinning top. The doji pattern occurs when the opening and closing prices are the same, which indicates indecision in the market. The spinning top pattern occurs when the real body is small and the shadows are long, again indicating indecision in the market.
Recommended Read:How to choose stocks for intraday trading
Interpreting Candlestick Patterns
Interpreting candlestick patterns involves analyzing the shape and color of the candlesticks and determining whether the stock’s price is likely to go up or down. For instance, a bullish candlestick pattern typically shows a stock’s price is rising, while a bearish pattern indicates that the price is likely to fall.
Traders need to familiarize themselves with different types of candlestick patterns so that they can made informed decisions for buying or selling stocks.
Technical analysis using Candlestick Patterns
Candlestick patterns are widely used to analyze and predict price movements in the stock market. Traders use these patterns to identify support and resistance levels, which help them determine entry and exit points for their trades. By combining candlestick patterns with other technical analysis tools, traders can develop effective & best option trading strategy that include risk management techniques. The patterns can also be used to determine the strength of a trend, potential reversals, and possible breakouts. Effective use of candlestick patterns requires an understanding of the underlying market conditions and the ability to recognize and interpret various patterns.
Common Mistakes in Using Candlestick Patterns
One of the common mistakes traders make is over-relying on candlestick patterns without considering other factors in trading. Ignoring factors such as market trends, economic news, and company fundamentals can lead to missed opportunities or losses. Another mistake is the misinterpretation of candlestick patterns. Traders need to be aware that not all patterns are reliable indicators of market movements, and sometimes patterns can be misleading. It’s essential to understand the context and apply other forms of technical analysis to confirm candlestick patterns. To avoid these mistakes, traders should have a well-rounded approach that incorporates multiple indicators and considers the broader market context.
Candlestick Patterns for Different Markets
Candlestick patterns can be used across different markets, including the stock market, forex market, and cryptocurrency market. In the stock market, candlestick patterns are used to identify trends and potential reversals. Similarly, in the forex market, candlestick patterns can provide valuable insights into currency price movements, helping traders to anticipate market trends and volatility. In the cryptocurrency market, candlestick patterns can be particularly useful, as this market is known for its volatility and rapid price movements. Traders can use candlestick patterns to identify patterns in the price data of various cryptocurrencies, which can help them make buying and selling decisions.
Advanced Candlestick Patterns
There are some advanced candlestick patterns, which are more complex than the basic patterns. Some examples of advanced candlestick patterns include tweezer tops and bottoms, three white soldiers and three black crows, rising and falling three methods, and abandoned baby. Tweezer tops and bottoms are two candlestick patterns that suggest a potential reversal in the market. Three white soldiers and three black crows are three candlestick patterns that indicate a strong trend in either the upward or downward direction. Rising and falling three methods are five candlestick patterns that provide a more nuanced view of market trends. Abandoned baby is a three-candlestick pattern that is a sign of a potential trend reversal. These advanced candlestick patterns require a thorough understanding of technical analysis and a careful consideration of market context to be used effectively.
Recommended Read:Introduction to derivatives trading strategies tips
Candlestick Pattern Tools and Resources
There are a variety of tools and resources available for traders interested in using candlestick patterns. One useful tool is a candlestick pattern scanner, which can automatically scan and identify different patterns in market data. There are also numerous books available on the topic, which provide in-depth explanations and analysis of different candlestick patterns. Websites and online resources can also provide useful information, including charts and analyses of candlestick patterns in different markets. Finally, some trading platforms offer built-in candlestick pattern recognition features, which can be useful for traders who want to quickly identify patterns and take advantage of market opportunities. By using these tools and resources, traders can become more confident in their understanding and use of candlestick patterns in their trading strategies.
Combining Candlestick Patterns with other technical indicators
Candlestick patterns are often used in conjunction with other technical indicators for assessing a complete picture of the market trends and movements. One commonly used indicator is moving averages, which help traders identify trends by smoothing out short-term price fluctuations. Combining candlestick patterns with moving averages can help traders identify key support and resistance levels and anticipate potential trend reversals.
Another popular indicator is the Relative Strength Index (RSI), which measures the strength of a stock & asset’s price movement. By combining candlestick patterns with RSI, traders can interpret market sentiment and identify potential buy or sell signals. Bollinger Bands are another technical indicator that can be used with candlestick patterns. Bollinger Bands are used to identify price volatility and potential breakouts, and when combined with candlestick patterns, they can help traders anticipate market movements and make more informed trading decisions.
By using all these technical indicators along with candlestick patterns, traders can certainly gain a more subjective understanding of market trends and movements, and develop effective trading strategies.
Conclusion
Understanding candlestick patterns is crucial for traders in predicting market behavior and making informed trading decisions. Trust, all the insights shared about candlestick charts will familiarize you with candlestick patterns and help you make informed decisions.